Institutional investors tend to focus heavily on relative strength; after all, this is essentially how they are evaluated in their performance as money managers! In this article, let’s review three ways to analyze relative strength and what these charts are telling us about sector rotation as we progress through Q4.
Relative Strength Trends Show Clear Winners in Q4
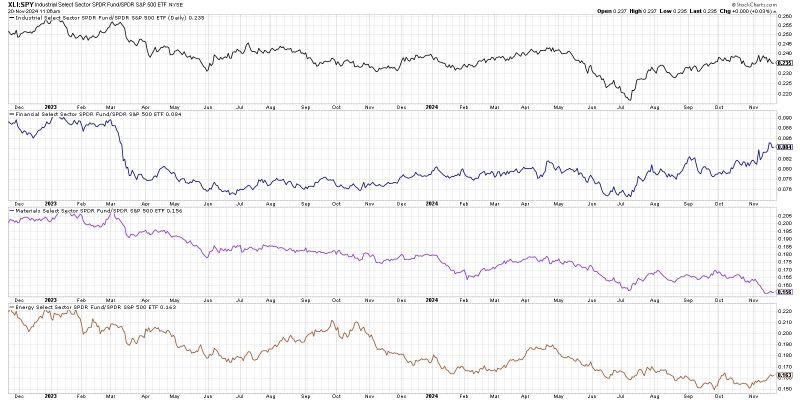
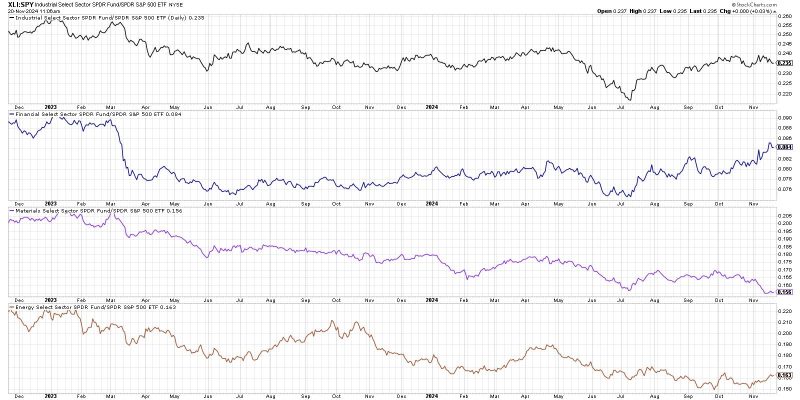
I like to group the 11 S&P 500 sectors into three important buckets based on their general tendencies: growth sectors, value sectors, and defensive sectors. Let’s focus in on the relative performance of the value sectors, with each line representing the ratio of the sector ETF vs. the S&P 500 ETF (SPY).
Two of these four sectors stand out as strengthening in the month of November, specifically the financial and energy sectors. Both of these sectors are expected to benefit from a Trump administration. Banks, it’s assumed, will be facing less regulatory pressure and also a steepening yield curve. For energy, it’s the assumption that with less support for renewable energy policies, oil and gas companies could stand to thrive going forward.
As my friend and fellow StockCharts commentator Tom Bowley once explained, “If you want to outperform the S&P 500, you need to own things that are outperforming the S&P 500.” So, by focusing on sectors that are showing stronger relative strength, we have the opportunity to outperform our passive benchmarks.
Offense vs. Defense Ratio Still Favoring Offense
I also love to use ratio analysis to compare sectors to each other, as we can then start to infer what big institutions are doing with their capital as they rotate between the 11 economic sectors. Let’s look at one of my favorite ratios, which I call the “offense vs. defense” ratio.
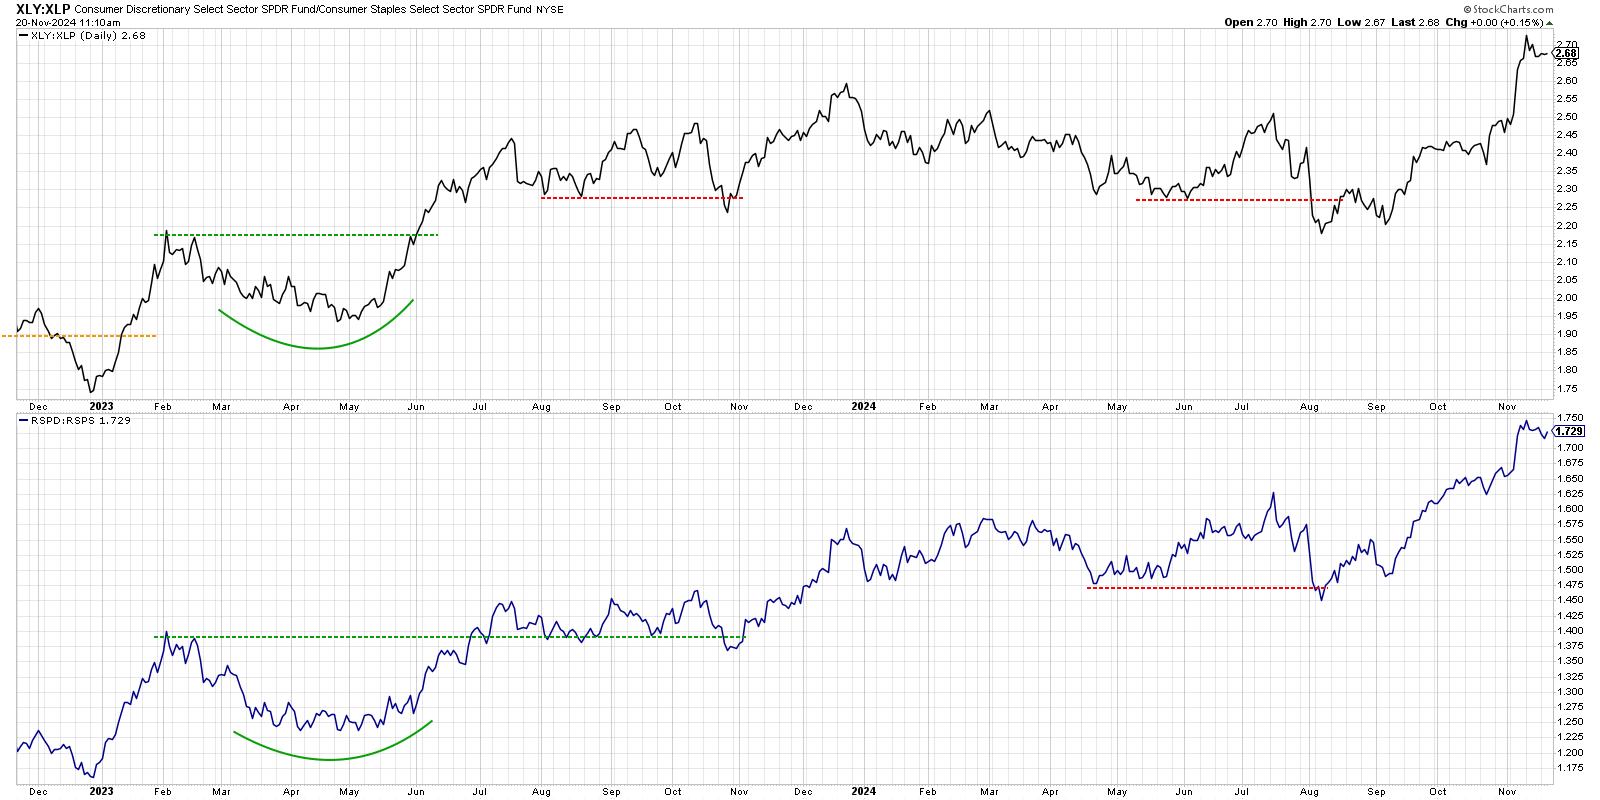
The top panel is the ratio of Consumer Discretionary (XLY) versus Consumer Staples (XLP), while the bottom panel uses equal-weighted ETFs for those same sectors (RSPD and RSPS). This analysis was inspired from conversations years ago with Bill Doane, my Fidelity predecessor who ran the Technical Research team in the 1970s. We are basically comparing “things you want” vs. “things you need”, with the idea that, when conditions are good, consumers tend to spend more money on discretionary purchases.
We can see in this chart that offense has been outperforming defense fairly consistently since early August. And if there’s one thing I’ve learned in 24 years of analyzing charts, it’s to assume that a trend is continuing until it doesn’t! So this chart certainly suggests broad market strength going into year-end 2024.
Relative Rotation Graph Indicates Resurgence in Key Sectors
No discussion of sector rotation would be complete without a nod to the GOAT of visualizing sector rotation, Julius de Kempenaer. His RRG charts have been an essential part of my toolkit for many years, and I’m thrilled that we now have an upgraded version on the StockCharts platform with which to continue our analysis.
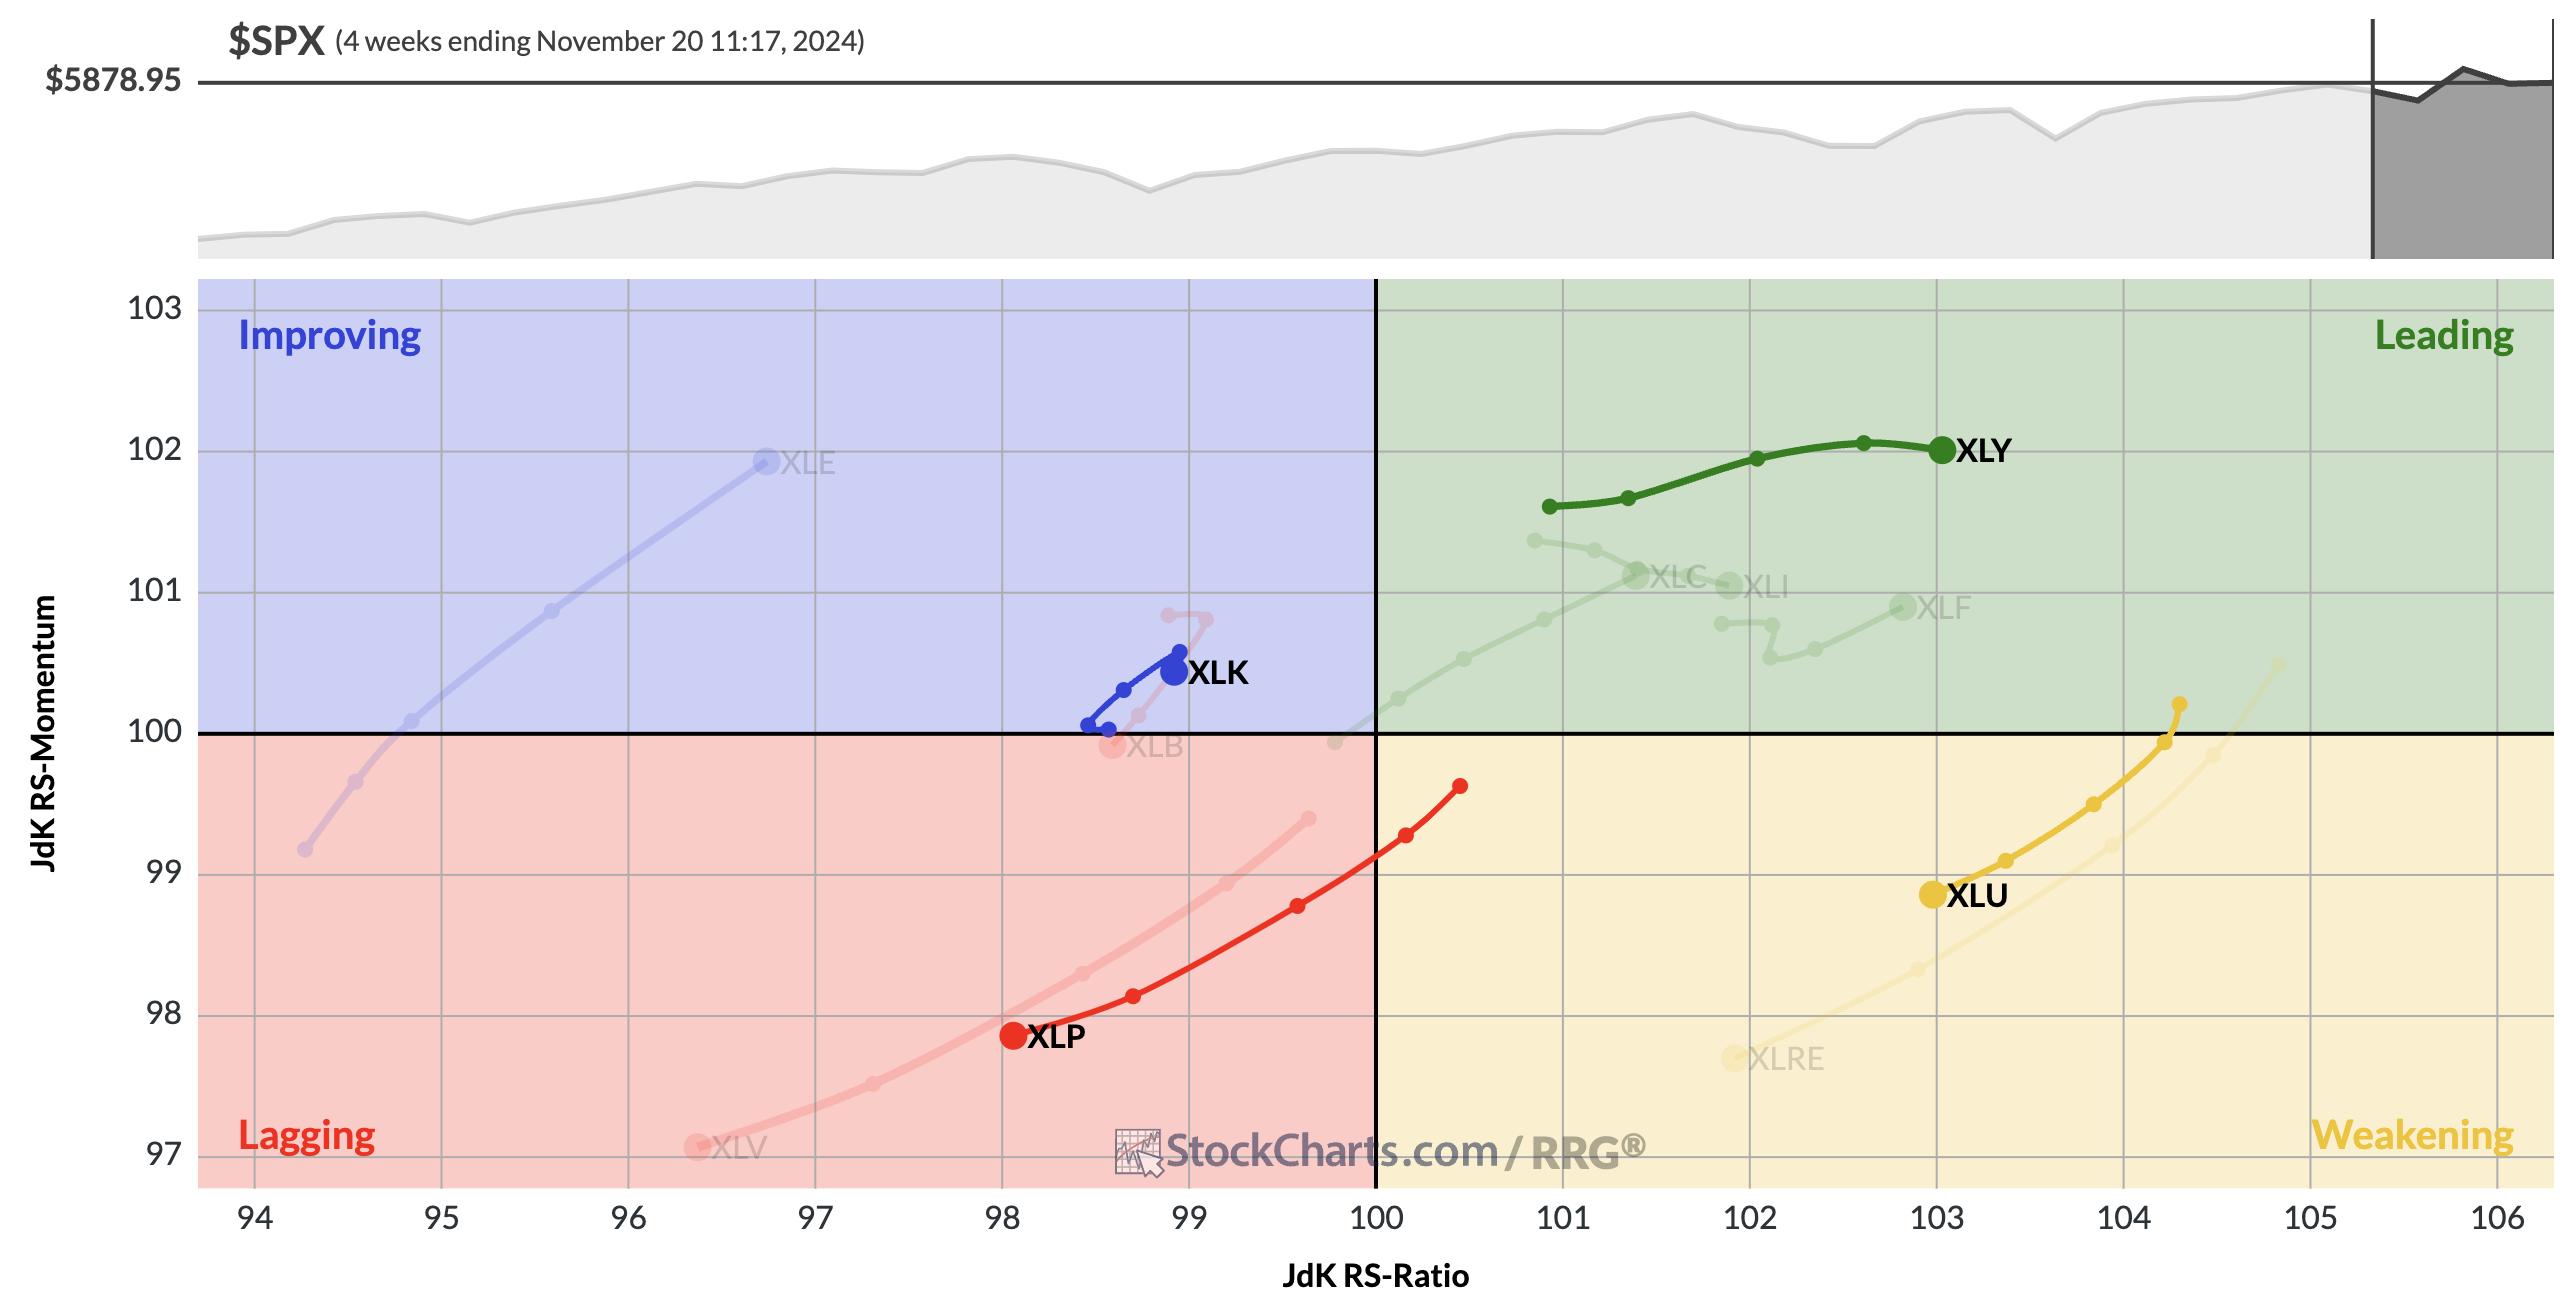
I’ve highlighted the two consumer sectors, which we can see support our earlier comments on offense over defense. The XLY is trending up and to the right in the Leading quadrant, and the XLP is moving down and to the left within the Lagging quadrant.
I’ve also selected one other comparison, which is one I’ll be watching closely as we head into 2025. Technology, driven by the strength of software and semiconductors, is currently in the Improving quadrant. Utilities, which has traditionally been considered as a defensive sector, sits in the Weakening quadrant.
If and when these relative trends would begin to reverse, that could and will indicate more defensive positioning than we’ve seen at all in 2024. But until and unless we see that sort of defensive rotation, my sector analysis tells me this market is poised for further strength.
RR#6,
Dave
P.S. Ready to upgrade your investment process? Check out my free behavioral investing course!
David Keller, CMT
President and Chief Strategist
Sierra Alpha Research LLC
Disclaimer: This blog is for educational purposes only and should not be construed as financial advice. The ideas and strategies should never be used without first assessing your own personal and financial situation, or without consulting a financial professional.
The author does not have a position in mentioned securities at the time of publication. Any opinions expressed herein are solely those of the author and do not in any way represent the views or opinions of any other person or entity.


