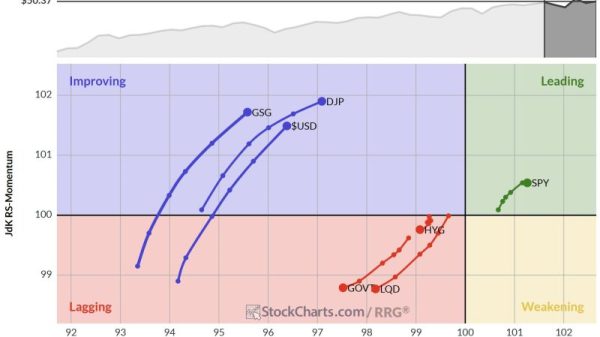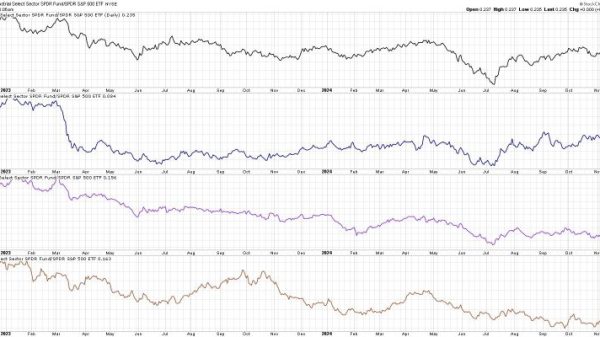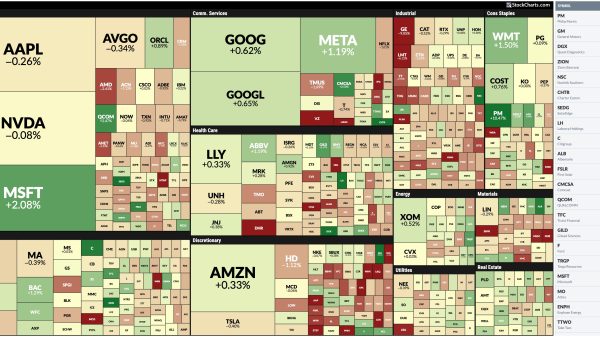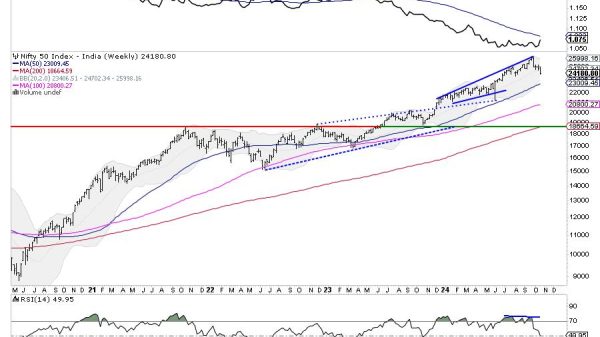
In this exclusive StockCharts video, Joe explains how to use an 18 simple moving average in multiple timeframes to identify when a stock has confluence amongst 2-3 timeframes. He shows how to start with the higher timeframes first, before working down to the lower ones. Joe then covers the shifts that are taking place in the sectors; in addition, he shows a nice feature in StockChartsACP that can help zero you in on new emerging strength. Finally, he goes through the symbol requests that came through this week.
This video was originally published on November 13, 2024. Click this link to watch on StockCharts TV.
Archived videos from Joe are available at this link. Send symbol requests to stocktalk@stockcharts.com; you can also submit a request in the comments section below the video on YouTube. Symbol Requests can be sent in throughout the week prior to the next show.


